Amidst the “maze” of thousands of tools available on the MetaTrader 4 platform, which MT4 indicators are truly effective in helping you make a profit?
At Wemastertrade, we always emphasize: “Indicators are not magic wands, but if you pick the right weapon, your win rate will increase significantly.”
This article filters out the Top 10 best indicators on MT4 trusted by experts, categorized by their purpose so you can easily build your own trading system.
Group 1: Trend Indicators – “Trend is Friend”
This group helps you identify the main market trend (Uptrend or Downtrend) so you never “stand in front of a moving train.”
1. Moving Average (MA)
The “king” among the best indicators on MT4—simple but extremely powerful.
- Purpose: Smooths price data to reveal overall direction.
- How to use:
- SMA (Simple MA): Use SMA 200 to identify long-term trend. Price above SMA 200 = Uptrend, Price below SMA 200 = Downtrend
- EMA (Exponential MA): Use EMA 34 or EMA 89 to find high-quality entry points because it reacts faster to price.
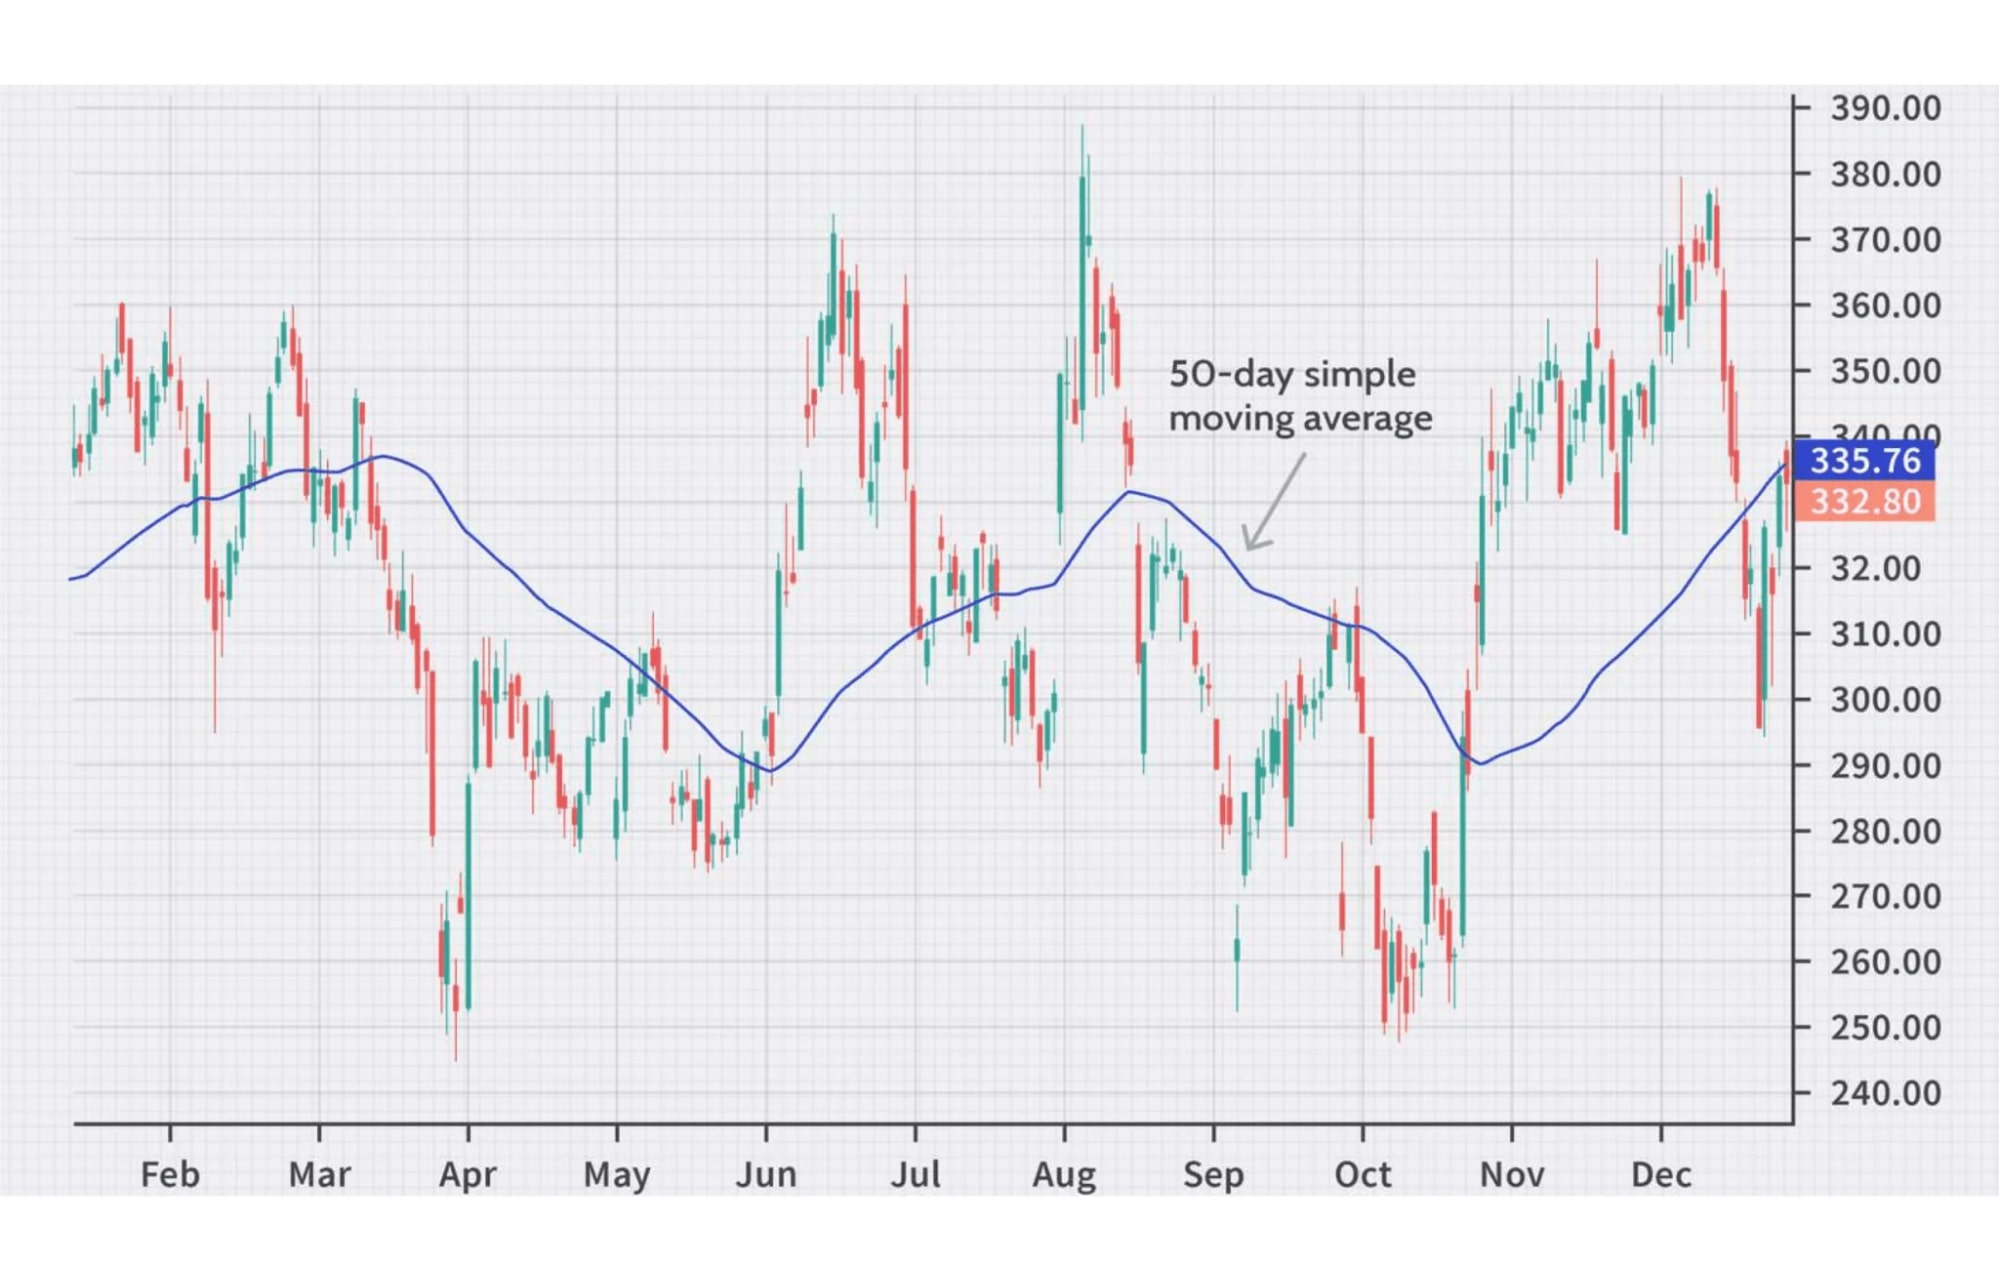
- Wemastertrade Tip: Use the crossover of two EMAs (short-term & long-term) to spot early reversal signals.
2. Bollinger Bands
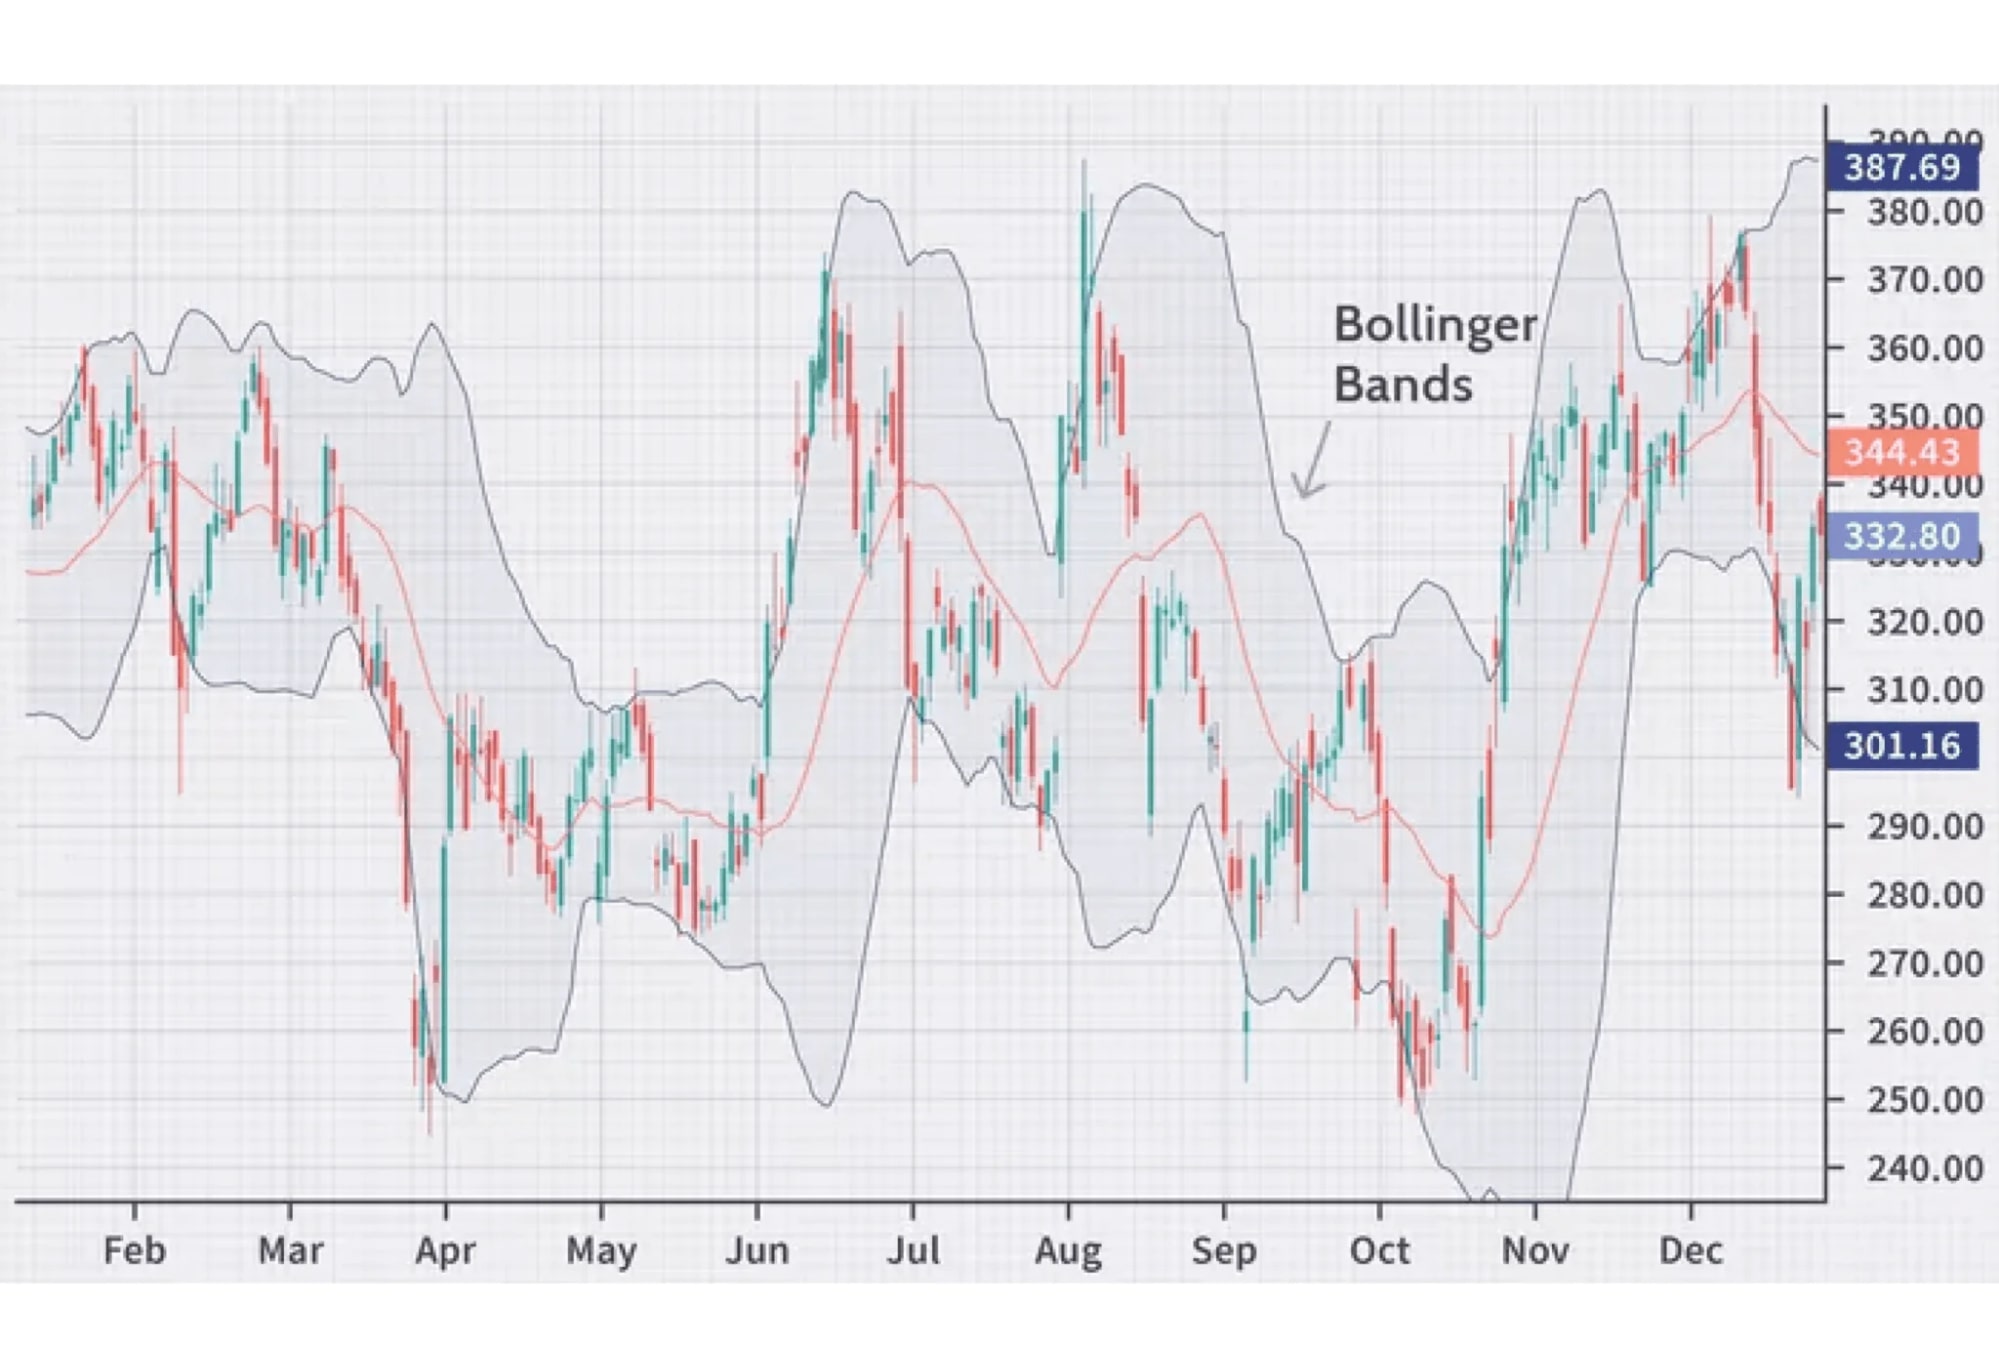
- Purpose: Measures market volatility.
- How to use: When the bands contract (Squeeze), it signals an upcoming strong breakout. When price touches the upper or lower band, the trend may slow or reverse.
3. Ichimoku Kinko Hyo
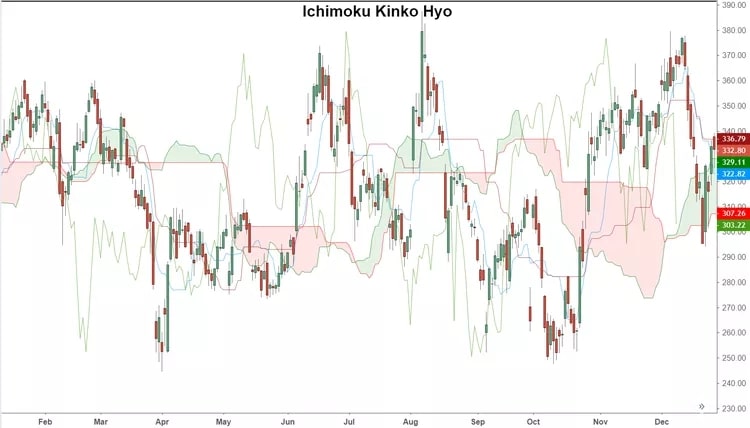
- Purpose: An “All-in-One” Japanese system. With just one glance, you can see trend, support/resistance, and momentum.
- Strength: The Kumo Cloud is an extremely reliable dynamic support/resistance zone unmatched by most other indicators.
Group 2: Momentum Indicators – Find Reversals
This group helps you know whether the market is “hot” or “cold” to decide when to buy lows or sell highs.
4. RSI (Relative Strength Index)
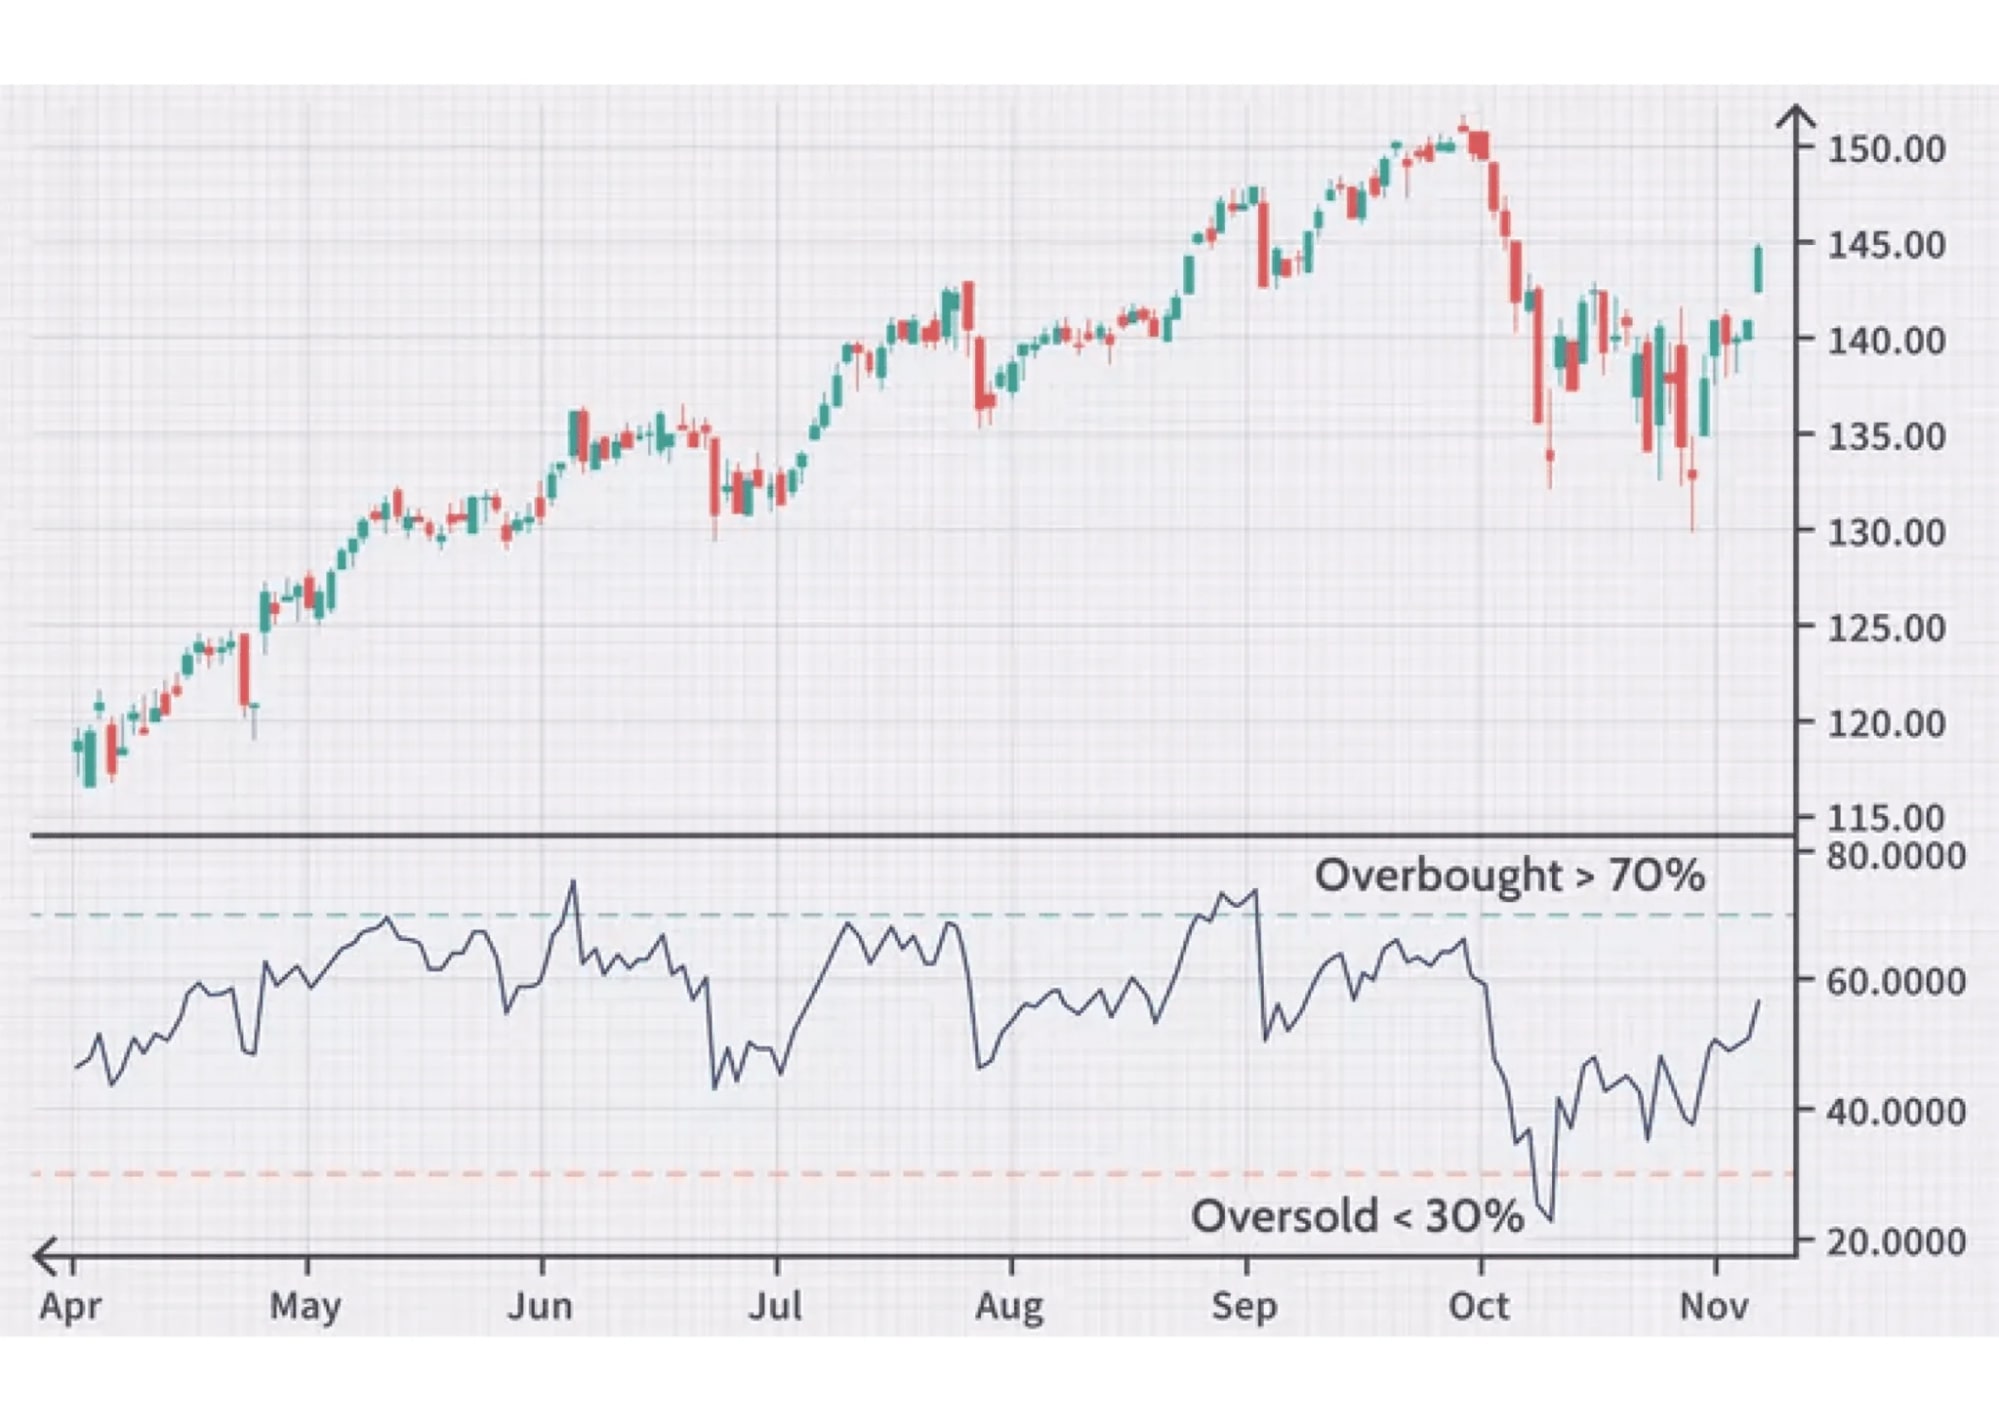
One of the best indicators on MT4 for spotting overbought and oversold zones.
- How to use: RSI > 70 → Overbought → Look for Sell, RSI < 30 → Oversold → Look for Buy
- Wemastertrade Tip: Don’t rely only on the 30/70 levels—look for divergence between price and RSI. It’s a highly accurate reversal signal.
5. MACD (Moving Average Convergence Divergence)
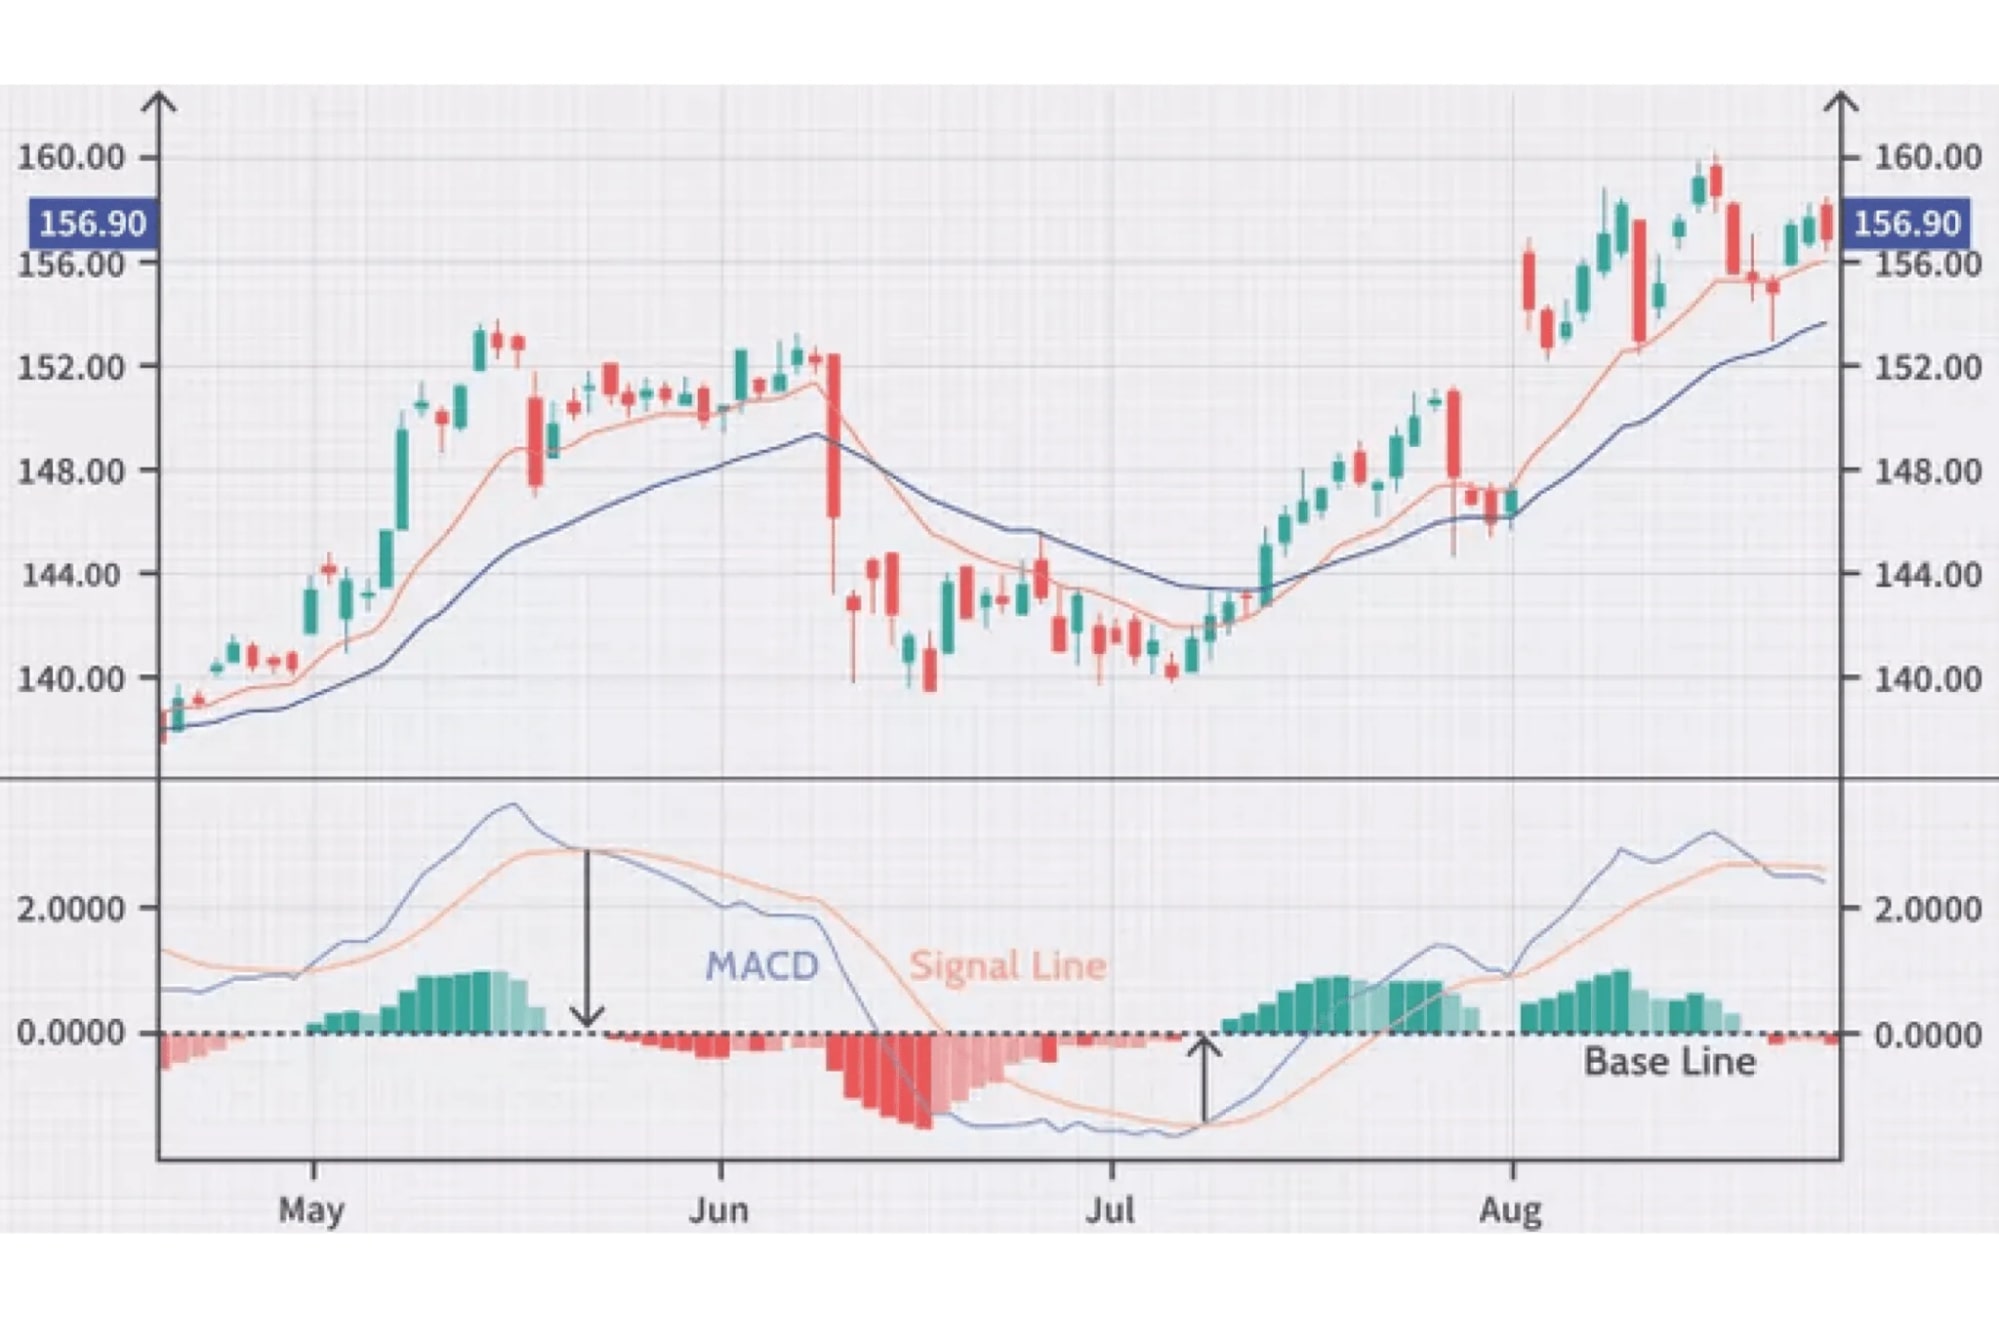
- Purpose: Shows the strength of the current trend.
- How to use: Watch for crossovers between the MACD line and Signal line, combined with the Histogram to determine whether buying or selling pressure is increasing or weakening.
6. Stochastic Oscillator
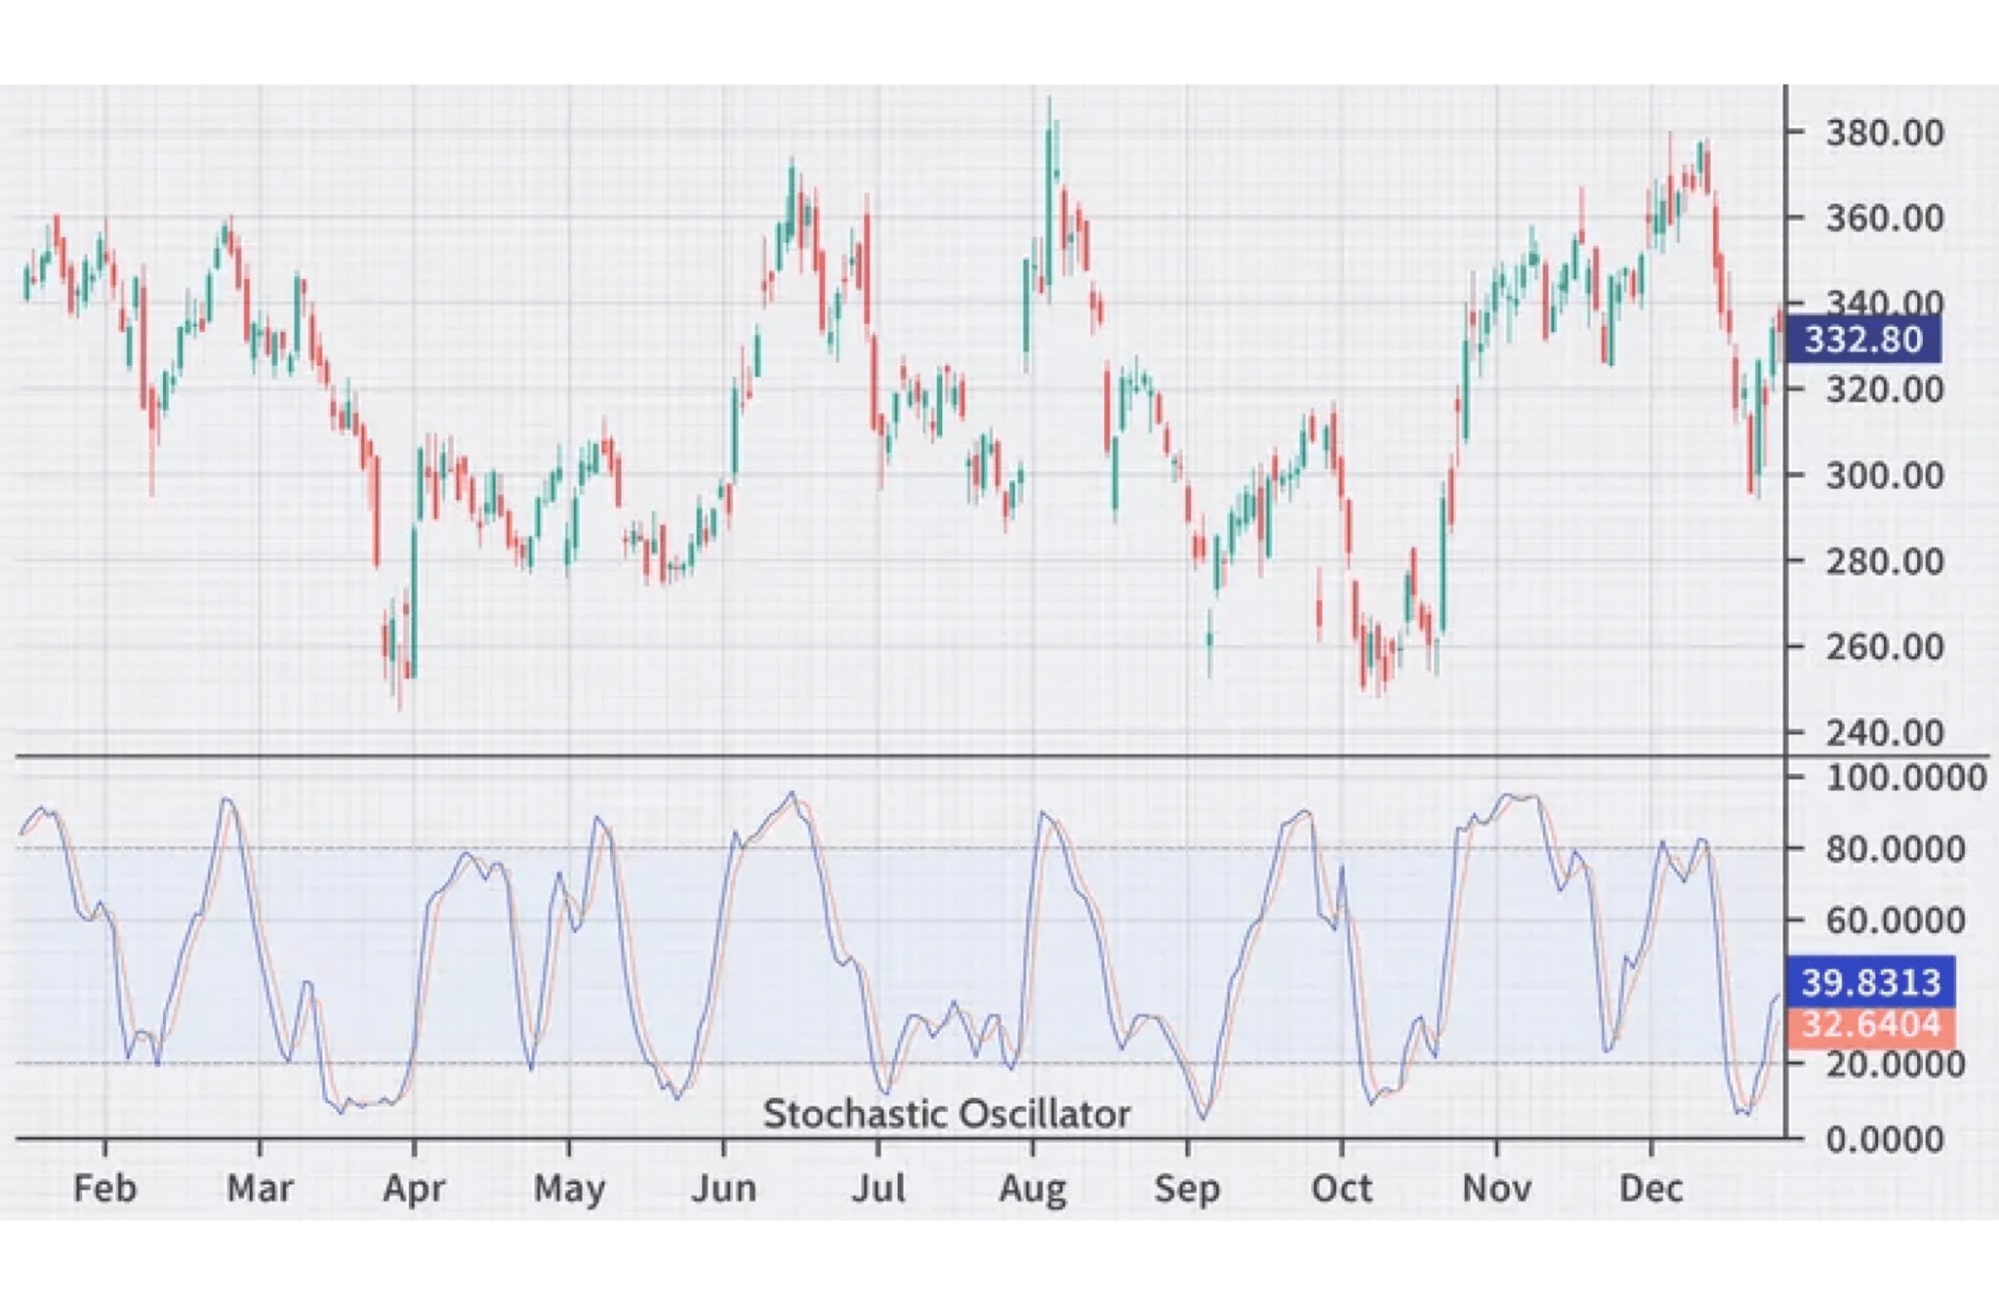
- Purpose: Similar to RSI but more sensitive—ideal for sideways markets.
- How to use: Look for %K and %D crossovers in overbought/oversold zones for quick scalping entries.
Group 3: Support & Resistance Indicators
Helps you identify the “floor” and “ceiling” of price movements.
7. Fibonacci Retracement
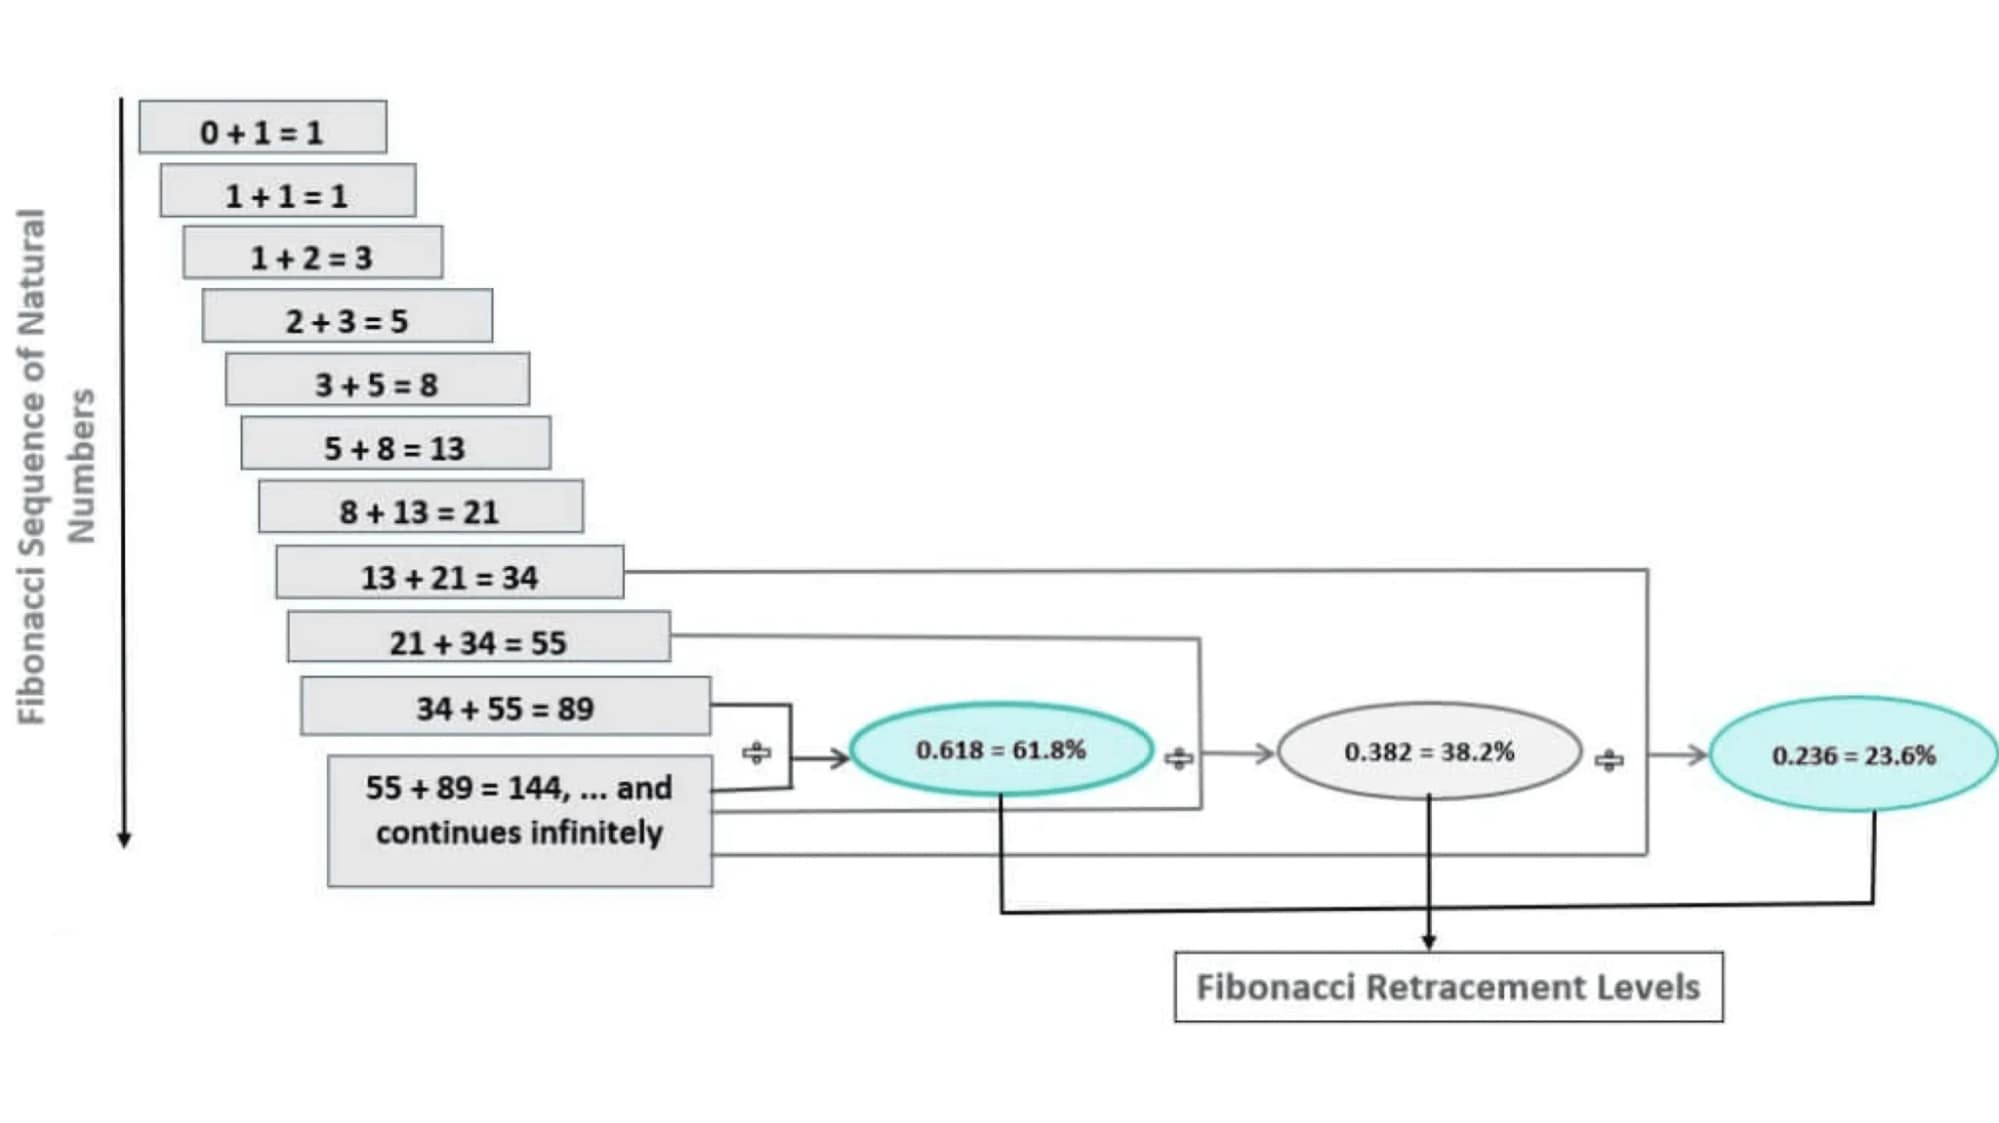
- Purpose: Measures how much the price retraces within a trend.
- Key levels: 0.5 and 0.618 (Golden Ratio). Price tends to bounce at these levels.
8. Pivot Points
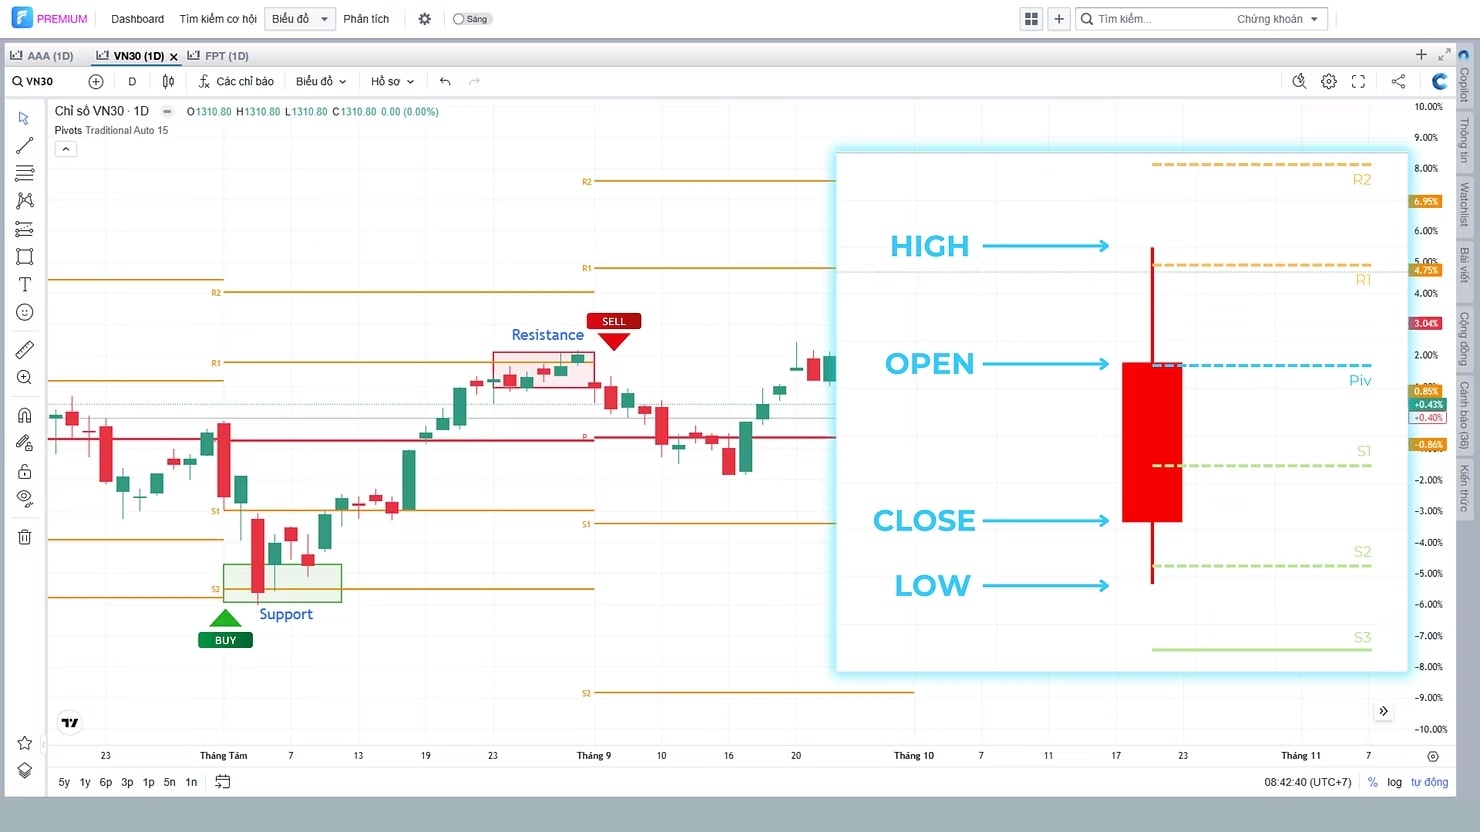
- Purpose: Automatically calculates key intraday support (S) and resistance (R) levels based on the previous day’s price.
- Advantage: Very objective; widely used by banks and funds (Big Boys) to place take-profit levels.
9. ZigZag
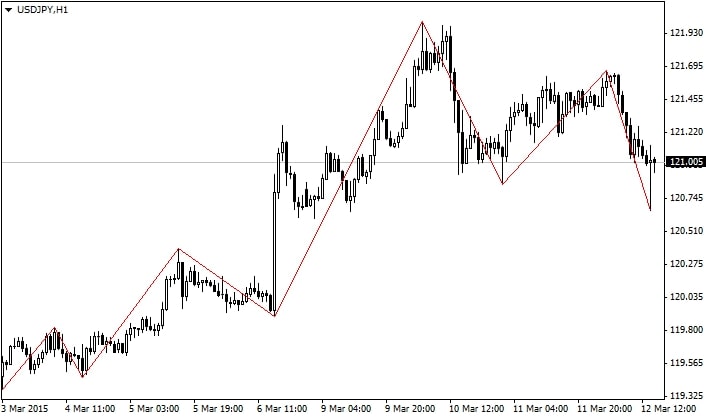
- Purpose: Filters market noise and clearly shows Highs/Lows.
- Applications: Excellent for drawing Trendlines or analyzing Elliott Wave structure more accurately.
10. Volume
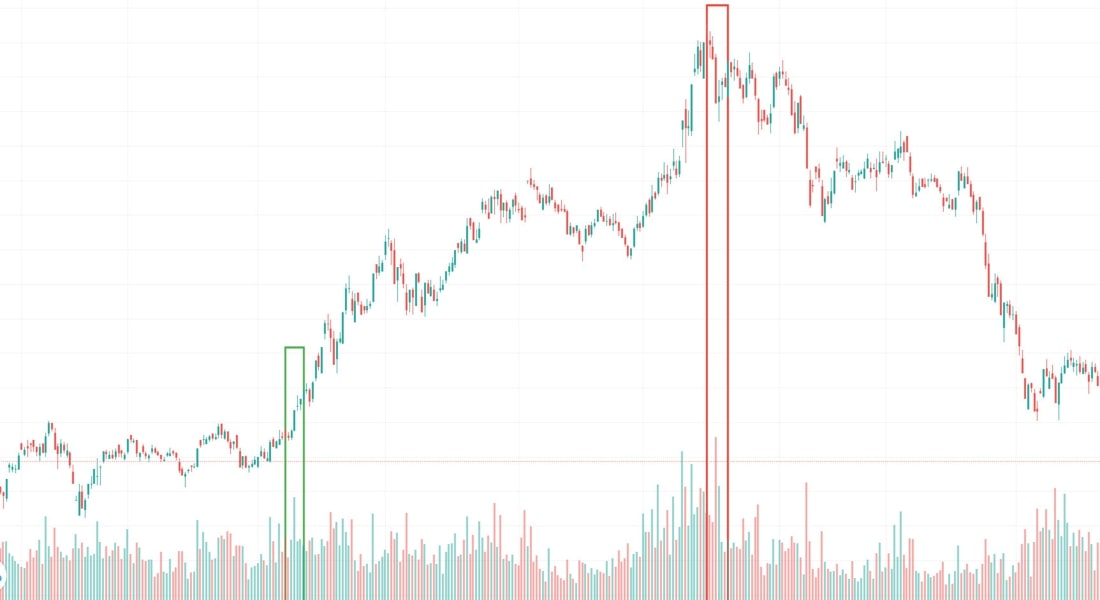
- Purpose: Confirms trend strength.
- Rules: Price increases with increasing volume => Sustainable trend. Price increases with decreasing volume => Signs of weakness, beware of a potential reversal.
“Professional-Level” Indicator Combination Strategy (Wemastertrade’s Formula)
Having the best indicators on MT4 does not mean you should load them all onto your chart—that only creates confusion.
Golden rule: Use 2–3 indicators from different groups to achieve confluence (multiple confirmations).
Example trading combo:
- Identify trend: Use MA 200 or Bollinger Bands.
- Find entry: Wait for price to retrace to Fibonacci 0.618.
- Confirm activation: Look for RSI divergence or oversold signal.
How to Add Indicators on MT4
If you’re a beginner, follow these steps:
- Open MT4
On the Menu bar, select Insert
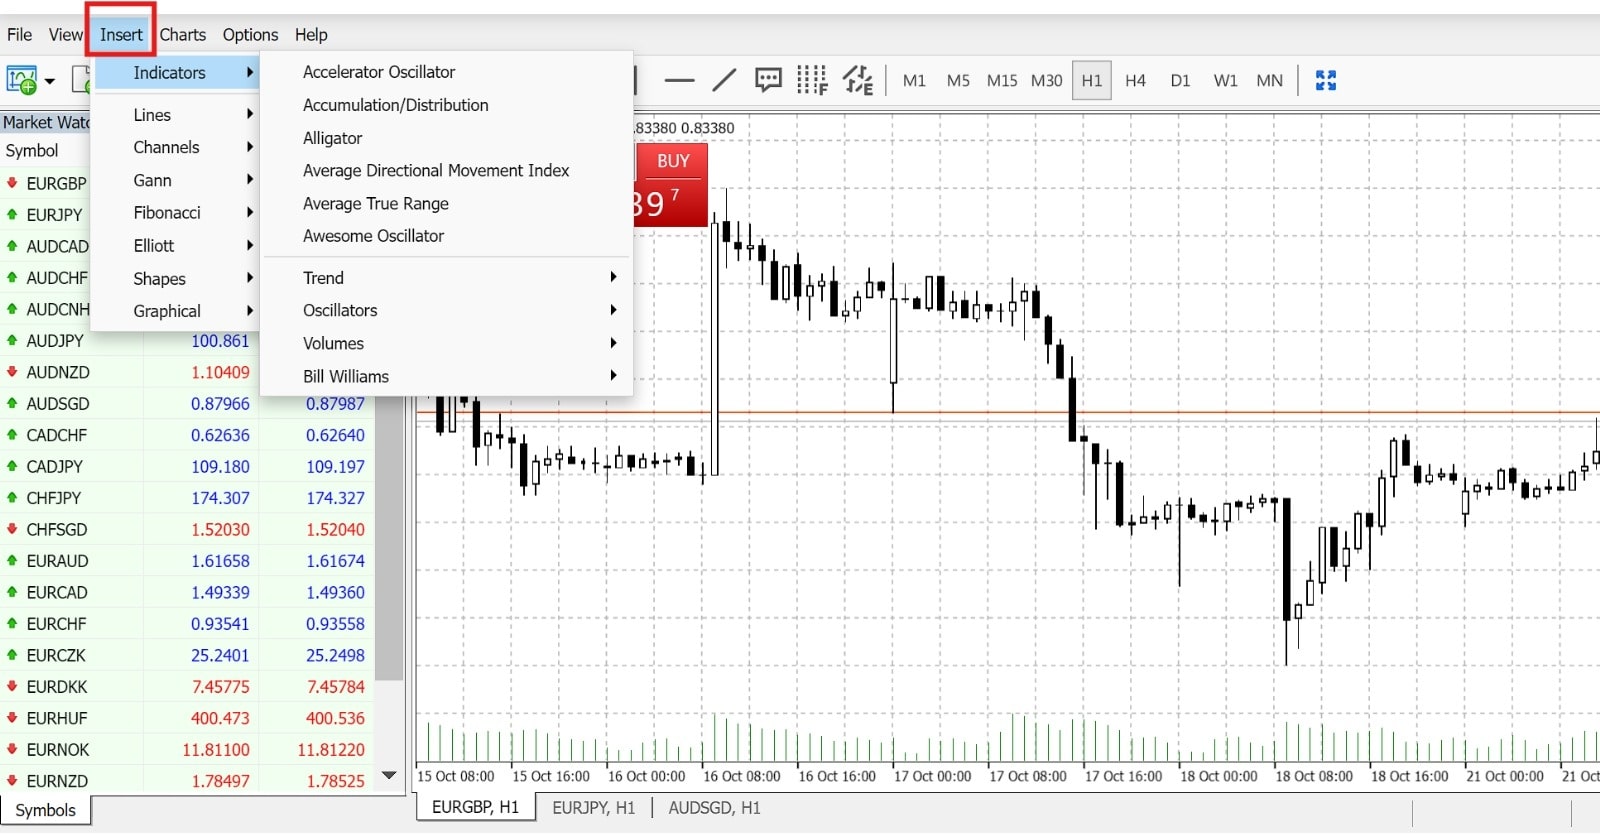
- Indicators.
- Select the category (Trend, Oscillators, Volumes, etc.).
- Click the indicator name and press OK.
If you want to install custom indicators downloaded from external sources, the process will be similar to installing the Robot:
Copy the .ex4 file to the following folder: Files
Open Data Folder
MQL4
MQL4
- Indicators.
Above are the Top 10 best indicators on MT4 in 2025. Remember, indicators are only supporting tools — your trading mindset and risk management are what truly determine success or failure.
You should choose 2-3 tools that best suit your style (Scalping or Swing) and practice them until you master them.
If you want to find advanced indicators with custom code or need guidance on setting up a complete trading system, please refer to the resource library at Wemastertrade. We wish you find the right “weapon” and achieve trading success!